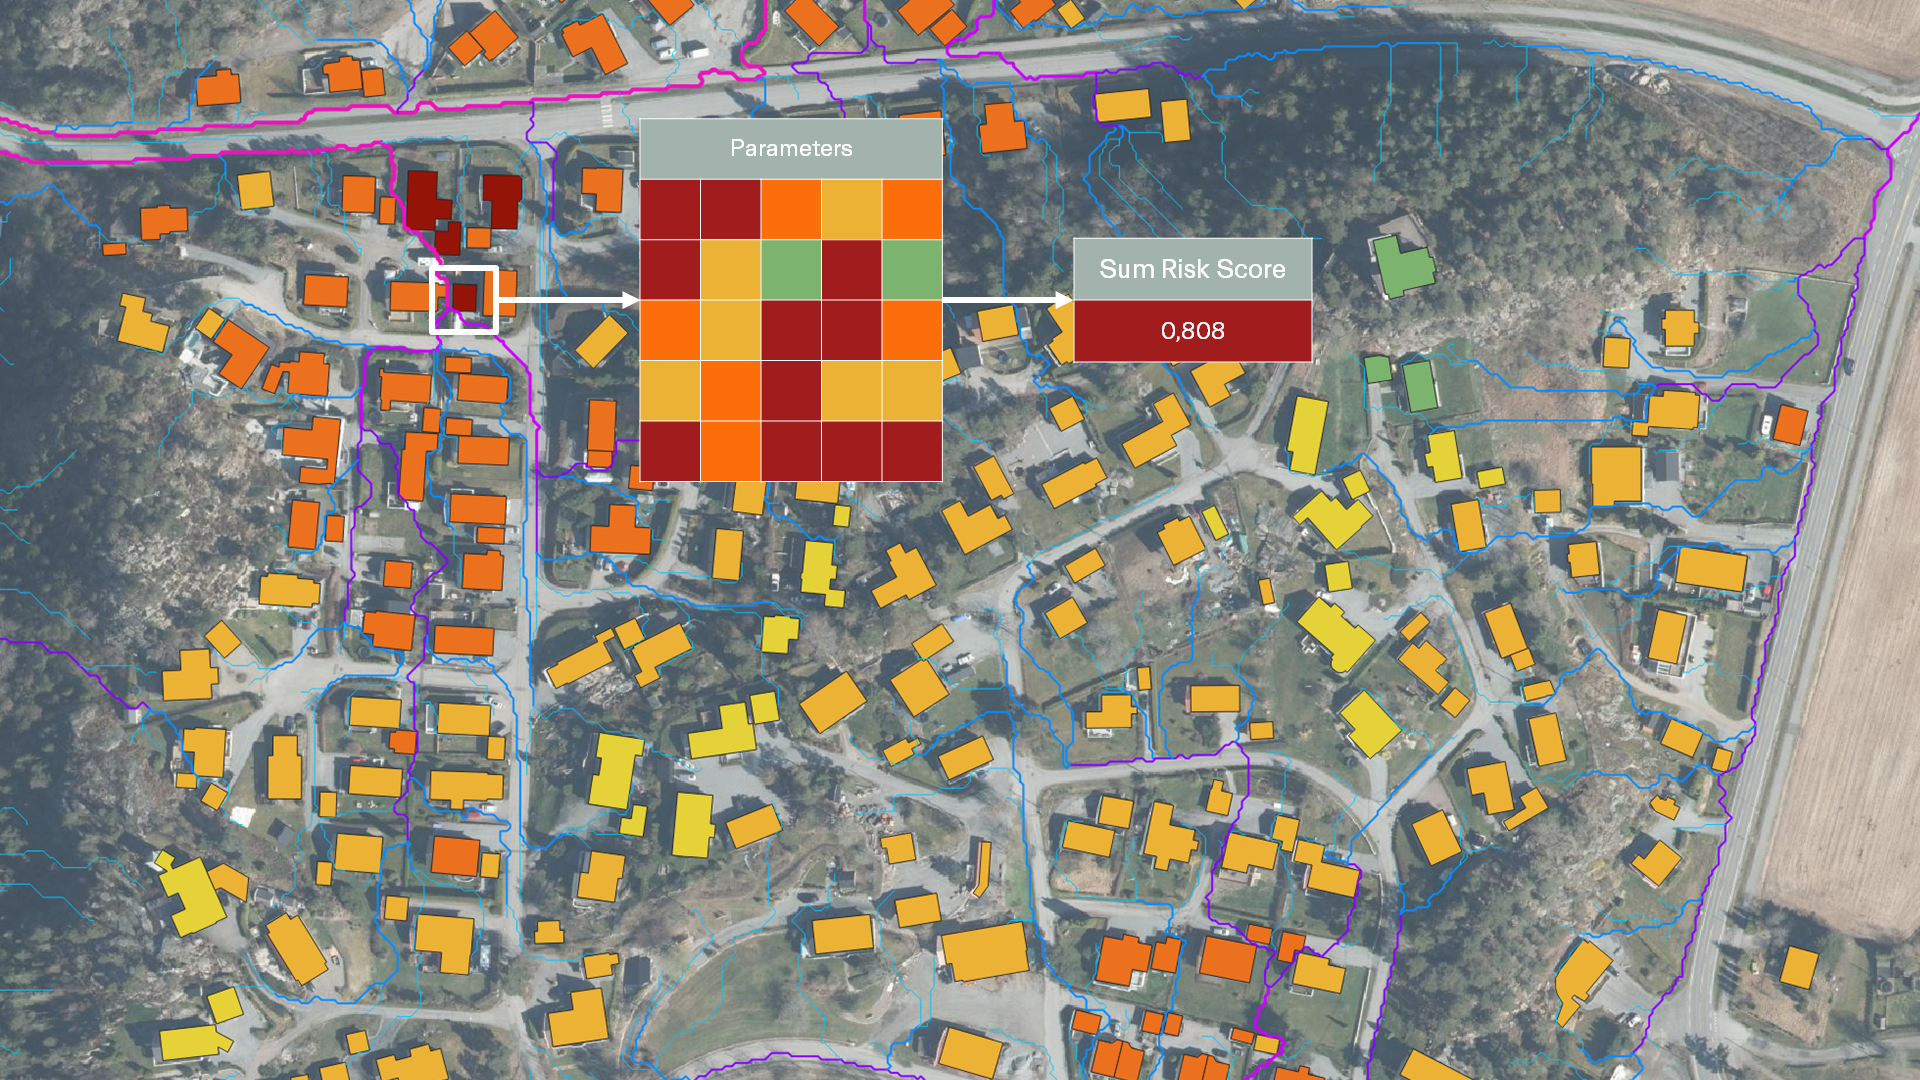
Insurance Profitability
Price the flood risk others miss — and protect your property portfolio's profitability
After applying our models across four continents and dozens of insurers, clear claims patterns have emerged — patterns that can inform pricing at very detailed levels.
Proof of concept — from the field
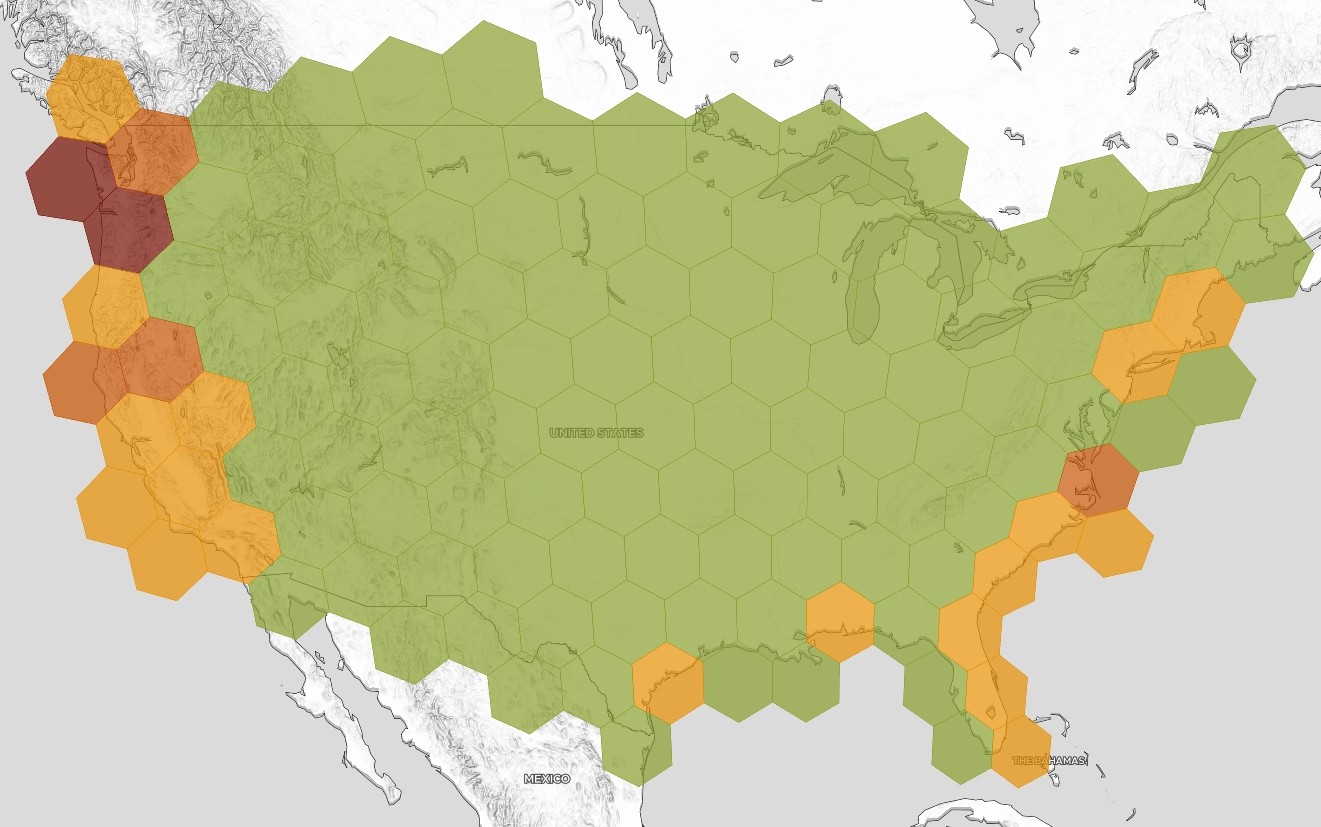
Pricing showed zero discrimination — until we overlaid the PFI
Two independent validation streams — one across almost a million properties in the US, one spanning 6 million buildings across 12 European insurers — returned the same finding: granular pluvial data stratifies loss ratios that conventional models leave flat.
The blind spot: Premium distribution tends to be flat across all PFI bands despite incorporating traditional flood model inputs. High-risk properties are priced identically to low-risk neighbours.
The signal: When claims history is overlaid, loss ratios vary by multiples across PFI bands — rising sharply and accelerating non-linearly at the upper end.
Adverse selection exposed: Market penetration is inversely correlated with risk score — a classic adverse selection signature.
~1M
US properties validated
6M
European property portfolio
5-10×
loss ratio/claims frequency,
high vs. low PFI
high vs. low PFI
The cost of mispriced flood risk
Mispricing flood risk has a direct P&L impact.
Underpricing high-risk buildings attracts the worst risks. Overpricing low-risk buildings drives away your best customers.
You lose the profitable business; you keep the unprofitable.
Benefits
What drives profitability improvements

01
Keep profitable customers
Accurate flood pricing means your low-risk customers are never overcharged. They stay — and so does the profitable premium they bring.
Partners
What our partners are saying
"The spread in loss frequency is particularly impressive"
Chief Actuary, Reinsurance Partner
"Pluvial flood is the market feature of the moment – and the next major event in a large European city will surprise a lot of people"
From the conference floor: pluvial flood is the conversation of the moment
"The collaboration with 7Analytics makes us market leading on physical climate risk"
Pål Sæterhagen, Head of Property Insurance at Fremtind

"Access to real-time, data-driven insights enables insurers to better support customers in understanding and mitigating their risks."
Scott Gunther, General Partner, IAG Firemark Ventures

Ready to access next-level flood data?
Book a demoUse cases
Keep exploring
Claims prevention
Bring down flood claims with early warning solutions
- Actionable early warning — push site-specific alerts to clients
- Data-driven incentives — offer discounts for resilience initiatives
- Capital efficiency — reinsurance capital buffer savings
Learn more
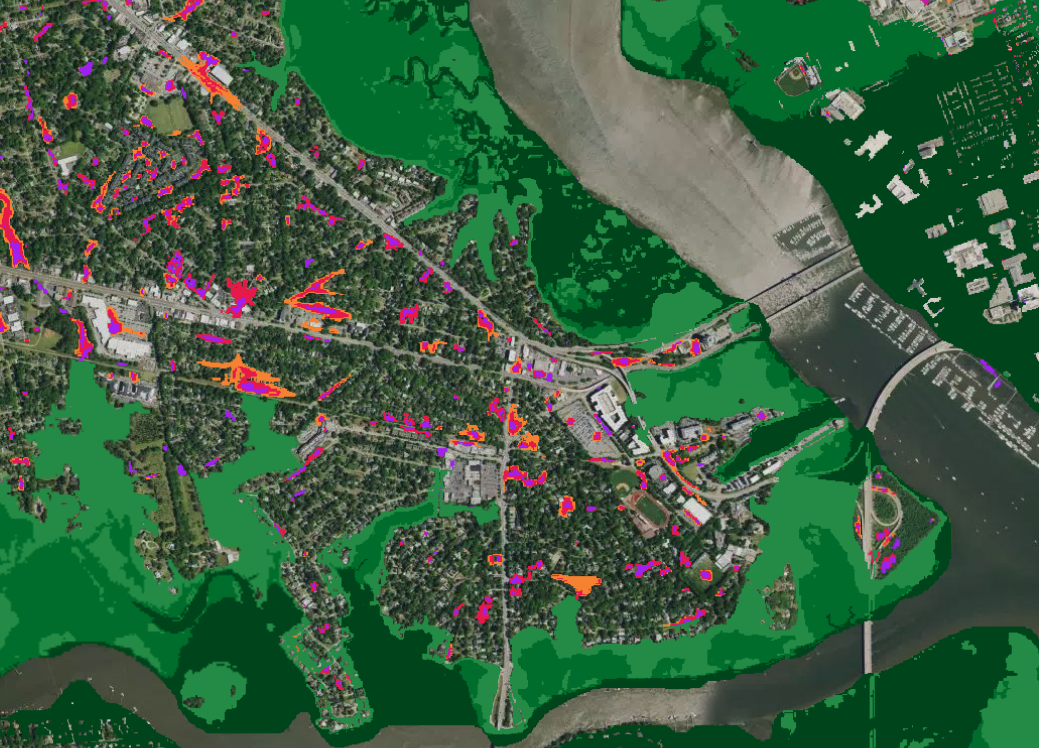
Event validation
Independent flood event validation powered by 1×1 m models
- Event validation independent of historical flood data
- 1×1 m frequently updated data reflecting real-world changes
- Verified insight for post-event assessment and model calibration
Learn more
Business continuity
Keep sites and operations safe when floods are creeping up
- Protect sites and inventory before water levels rise
- Reroute supplies, staff, and customers to ensure continuity
- Communicate effectively with employees, clients, and stakeholders
Learn more