1 x 1 m geospatial resolution land-use cover and terrain data
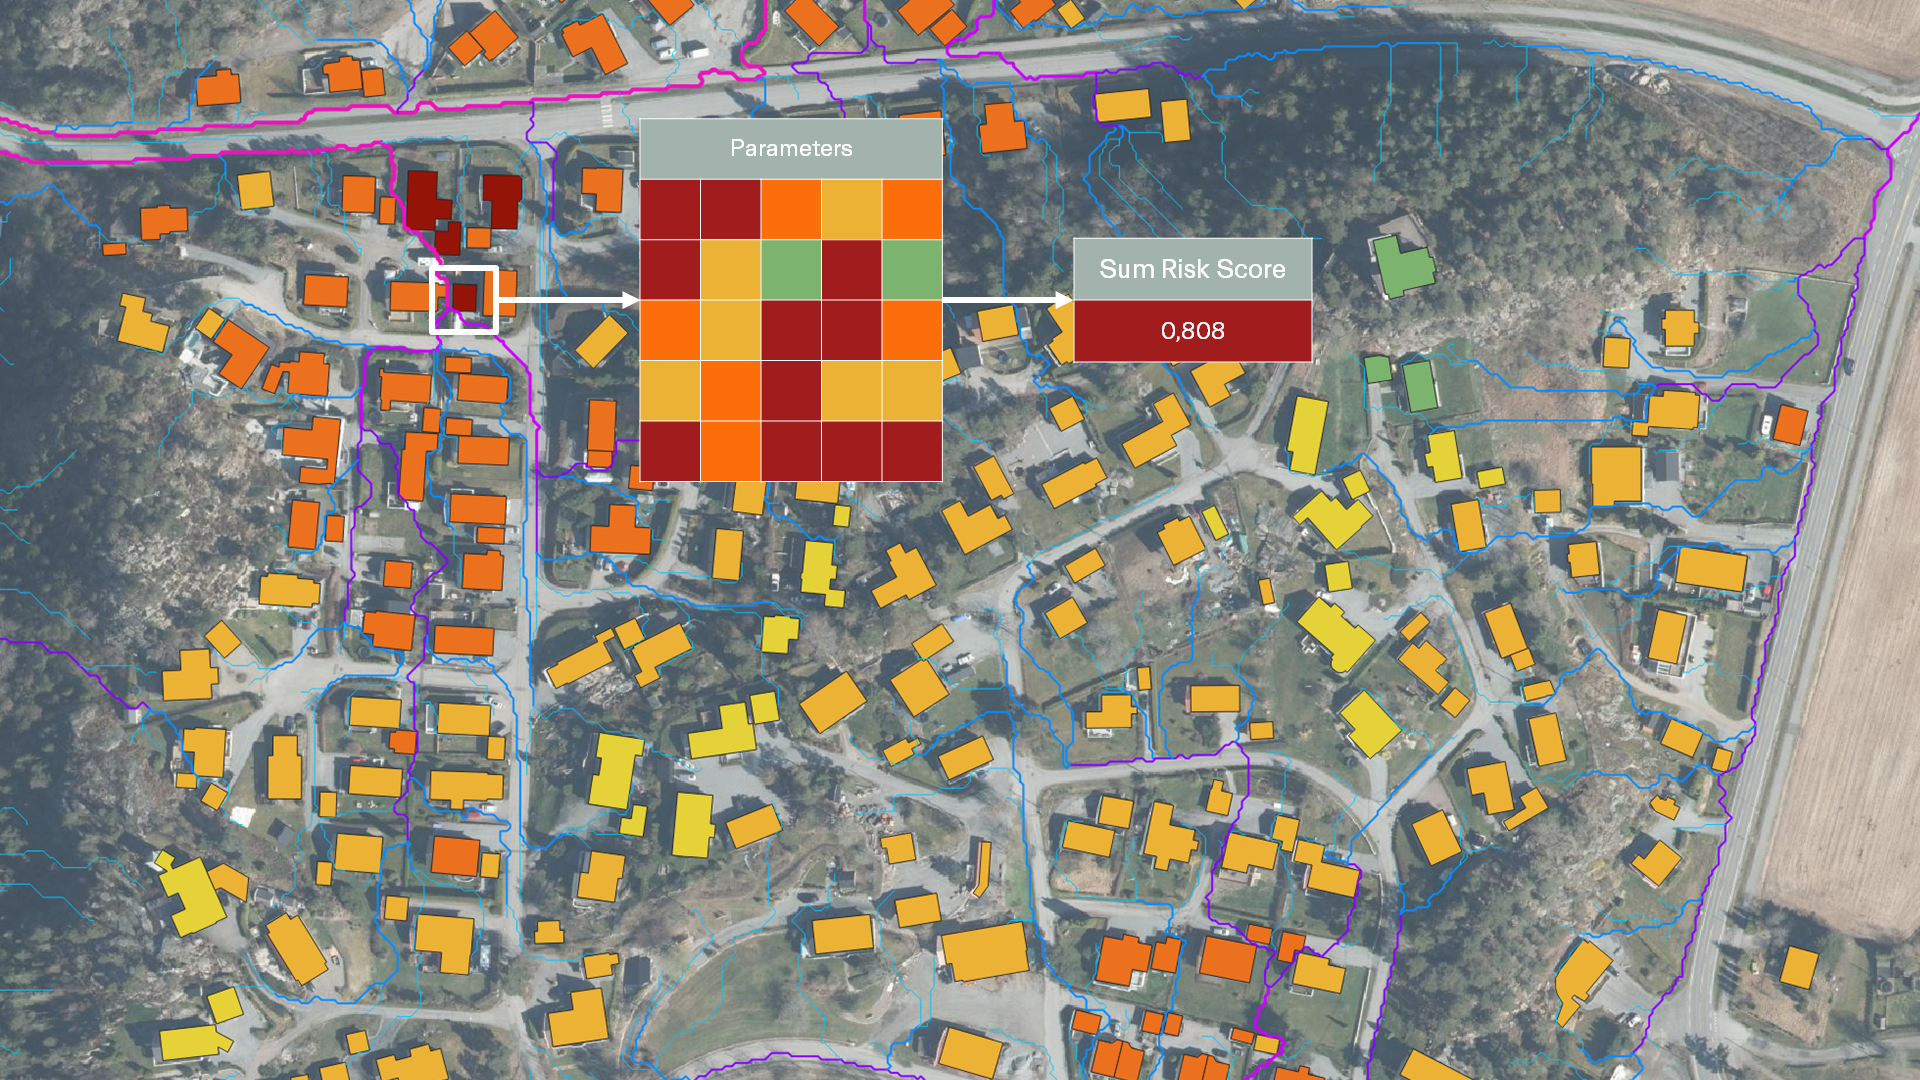
What is different about our approach?
Resolution

Input data update
Continuous reprocessing of new data

Claims training
Trained and calibrated on verified insurance claims
How granular flood risk data impacts profitability of insurance companies
Flood risk can vary dramatically, even between neighboring properties. Capturing these differences requires the right combination of high-quality data, robust modeling, and flood-specific insight.
To understand how data quality influences profitability, one of our insurance partners tested 7Analytics’ model on 50,000 properties across two states on the US East Coast.
- Step one: When comparing the Pluvial Flood Risk Index, there was no discrimination in their as-is premiums. In other words: Pricing was the same across flood risk categories. This was despite pricing had taken traditional flood model insights in to account.
- Step two: Next phase in the validation was to match with historic claims. Here, there was a sharp correlation with 7Analytics’ flood risk categorization. Loss-ratios were multiples higher in higher risk categories (see illustration).
The exercise was eye-opening to the insurer. Based on the novel data, they gained a strong basis for re-pricing and portfolio rebalancing.
After having applied our models across four continents and numerous of insurers, claims patterns have emerged. These patterns can inform existing price and risk models at very detailed levels to ensure insurance profitability even in a risky climate.
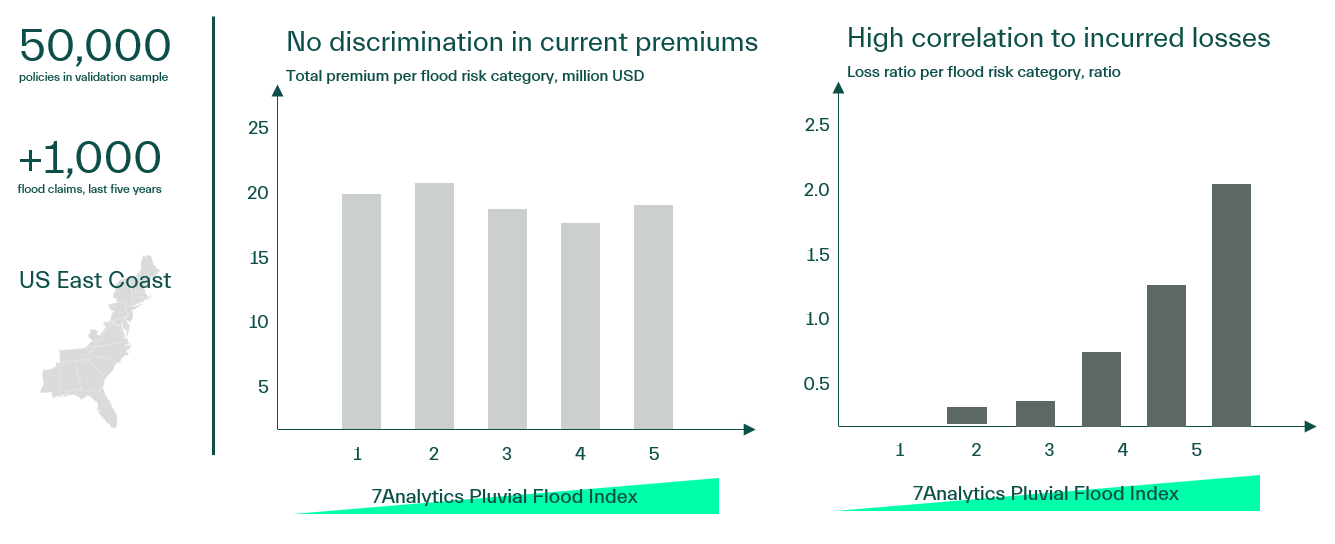
> Illustration: Proof-of-Concept Results paving the way for risk-reflective pricing and improved profitability <
How to test the data
We make it easy to validate the value and accuracy of our pluvial flood index — with minimal effort from your internal team. With just a few steps, you can get high-resolution flood risk insights tailored to your locations.
Step-by-step process
- Select your area of choice:
Choose any city or region — from 1,000 to 100,000 buildings. - Send your locations
Share building addresses or coordinates with us securely. - We score the buildings
7Analytics assigns flood risk scores to each property based on our 1×1 m pluvial flood model. - We share the results
Receive detailed insights for comparison with your historical data (e.g. 3–5 years of claims). - Joint results workshop
Together, we review findings, identify patterns, and discuss how to integrate results into your workflows.
Two options to run the pilot
- Option 1: Validate the model using your location-specific claims data.
- Option 2: Compare our pluvial flood index with your existing flood models and jointly explore properties with large discrepancies
Features

What some of our
partners are saying
-

Scott Gunther IAG Firemark Ventures General Partner
Access to real-time, data-driven insights enables insurers to better support customers in understanding and mitigating their risks
-

Pål Sæterhagen, Head of Property Insurance at Fremtind
The collaboration with 7Analytics makes us market leading on physical climate risk
-

Tore Tenold, CEO of KLP Insurance
7Analytics’ innovative flood risk model nicely supplements our existing risk modelling and deepens our understanding of the risk landscape ahead
-

Håkon Hommerstad-Tveit, Head of Product, Data, and Analytics at JBF Insurance
Our collaboration with 7Analytics will not just improve our flood risk assessments but also actively prevent damage and protect our customers’ interests
Use cases
- Actionable early warning –Push site-specific alerts to clients.
- Data-driven incentives – Offer discounts for resilience initiatives that bring down risk
- Capital efficiency –Reinsurance capital buffers savings
- Event validation independent of historical flood data
- 1×1 meter frequently updated data reflecting real-world changes
- Verified insight for post-event assessment and model calibration
- Protect sites and inventory before water levels rise
- Reroute supplies, staff, and customers to ensure business continuity
- Communicate effectively with employees, clients, and stakeholders
Bring down flood claims with early warning solutions
Use our data for damage prevention to bring advanced flood modelling to policy-holders in real-time. As insurer, you will get:
Independent flood event validation powered by 1×1 m models with up-to-date input data
Tricker payout and compare claims with modelled flood depths on a building-by-building basis:
Business continuity: Keep sites and operations safe when floods are creeping up
7Analytics’ real-time forecasting and monitoring solution translates data into action, by empowering businesses to: