How can Uber’s H3 system mobilize flood analytics?
By delivering scalable visuals that capture curb-level detail while providing an optimization framework for massive, city-wide datasets — this is both a cornerstone of how we present our data and the subject of a newly published research paper.
The paper, appearing in the International Journal of Disaster Risk Reduction, was co-authored by 7Analytics’ Werner Svellingen and Geir Torgersen alongside Oddbjørn Bruland and Tone Muthanna.
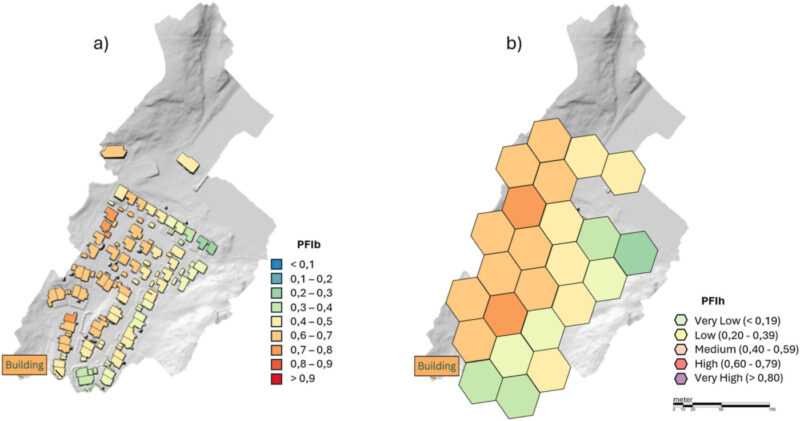
The research uses New York City as its case study, moving fluidly from a broad municipal overview down through urban districts to individual properties. The resulting flood susceptibility maps do more than visualize risk — they reveal how hotspots are distributed across jurisdictions, giving planners and decision-makers the granular intelligence they need to act.
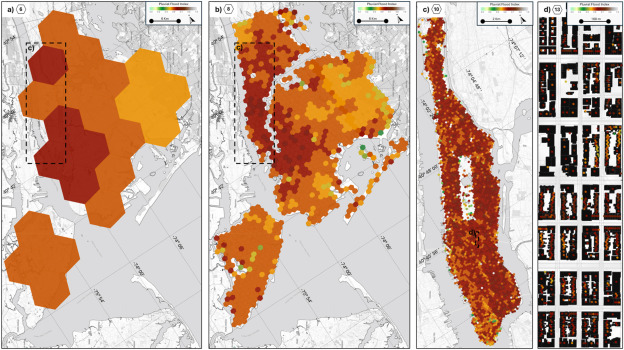
Hexagonal aggregation produces consistent spatial patterns and cleaner neighborhood relationships across resolutions. Crucially, the framework achieves this not through complex hydrodynamic modelling, but by harnessing high-resolution geospatial data — signalling a broader shift toward leaner, data-driven flood risk assessment that aligns with how modern policy is moving: adaptive, evidence-based, and built for scale.
Svellingen et al. (2026): “Scalable pluvial flood risk assessment: A data-driven framework integrating machine learning (ML) and discrete global grid systems (DGGS H3)”, International Journal of Disaster Risk Reduction, Volume 137, 15 April 2026.