Modelling approach – Why does 7Analytics take a data-centric rather than a model-centric approach to flood prediction, and what does this mean in practice?
Traditional flood modelling has been largely model-centric: elaborate process-based simulations built around hand-coded physical equations. While these models carry real scientific value, they demand a lot of computing power, are slow to update, and often struggle to keep pace with the rapid changes in land use, urbanization, and climate patterns that drive real-world flood risk.
7Analytics takes a data-centric approach, meaning that high-quality, high-resolution data is treated as the primary asset — not a secondary input to a fixed model structure. The principle is straightforward: rich, locally relevant data can outperform, or at least significantly enhance, the predictive power of even highly complex models. AI and machine learning algorithms are deployed to detect patterns across large and heterogeneous datasets — patterns that conventional rule-based methods routinely miss.
In practice, this means integrating 1×1 m terrain data, satellite-derived land use, live weather feeds, sensor observations, and historical flood and claims data into a continuously learning system. Rather than recalibrating a static model periodically, the 7Analytics approach updates its understanding of local flood dynamics as new data arrives — making predictions more accurate, more localized, and more resilient to a changing climate.
Physics first – How does 7Analytics combine physics-based hydrological understanding with machine learning, and why does neither approach alone produce sufficient accuracy?
Physics-based hydrological models are grounded in well-established understanding of natural processes — rainfall, infiltration, runoff, and river routing. They are interpretable, adjustable based on scientific knowledge, and do not require large volumes of observed training data. However, when applied to complex, real-world catchments in real time, their ability to represent actual conditions is often incomplete: they can miss important local dynamics, are demanding at high resolution, and require extensive calibration.
Data-driven machine learning models, on the other hand, excel at capturing non-linear relationships and subtle patterns across large datasets — including patterns in streamflow behavior that no explicit physical equation currently describes.
7Analytics combines both. Physics provides the structural backbone — governing where water can go, how terrain shapes flow paths, and how catchment characteristics translate rainfall into runoff. Machine learning is layered on top to calibrate, refine input data, and continuously enhance predictions. The result is a hybrid system that is both physically defensible and empirically accurate — more capable than either approach alone. Technically, this is described as a Physics Constrained Neural Network (PCNN)

Hydrological engine – Where does the 7Analytics real-time flood model sit relative to pure terrain analysis, hydrological models, and full hydraulic models?
It is useful to understand what each model type does. Terrain analysis is purely geometric: it identifies where water can flow based on topography alone, with no physics and no water volume. Hydrological models translate meteorological inputs into hydrological outputs — estimating how much water runs off, when, and where. Full hydraulic simulates depth, velocity, and flood extent with high physical fidelity, but at significant computational cost.
The 7Analytics real-time flood model occupies a deliberate position between hydrological and full hydraulic modelling. It is best described as a rapid 2D hydrodynamic inundation model. The core engine is based on the Weighted Cellular Automata 2D (WCA2D) framework: rather than solving the complete shallow water equations, the model uses a weight-based system to route excess water across the landscape — filling depressions, spilling between connected low points, and propagating flow downslope via D8 routing.
This delivers the spatial outputs that matter operationally — flood depth and inundation extent — at a fraction of the computational cost of full hydraulic simulation.
Velocity is deliberately excluded. Velocity requires solving the momentum equations, which adds substantial computational load and data requirements.
For early warning, flood depth and extent are the key outputs. Delivering these across all flood types and updated hourly over large areas, is not yet feasible with full hydraulic modeling. The WCA2D approach makes this scale possible without sacrificing spatial detail.

Input data – What types of weather, hydrological, geospatial, and infrastructure data does the system use, and how are areas with and without gauge data handled?
The system ingests data across four broad categories. Weather data includes live rainfall observations from rain gauges and radar, combined with calibrated numerical weather forecast data to drive the 72-hour outlook. Hydrological data includes river level sensor readings, discharge records, and where available, rating curves that translate water level measurements into flow estimates at specific cross-sections. Geospatial data encompasses high-resolution terrain models (1×1 m), satellite-derived land use classifications, building footprints, and topographic indices such as slope, flow accumulation, and wetness index. Infrastructure data covers drainage network characteristics, culvert and road underpass locations, and where available, local stormwater system specifications.
A key challenge in operational flood forecasting is that sensor coverage is uneven: major rivers are typically well-gauged, but second and third-order streams — which drive a large share of flash and pluvial flooding — often have no in-situ monitoring at all. 7Analytics is on a mission to address this with neural networks trained on gauged basins that transfer learned hydrological behavior to ungauged catchments with similar physical characteristics. These models produce short- and medium-horizon discharge forecasts across the full basin network — gauged or not —and flag capacity exceedance wherever it occurs.
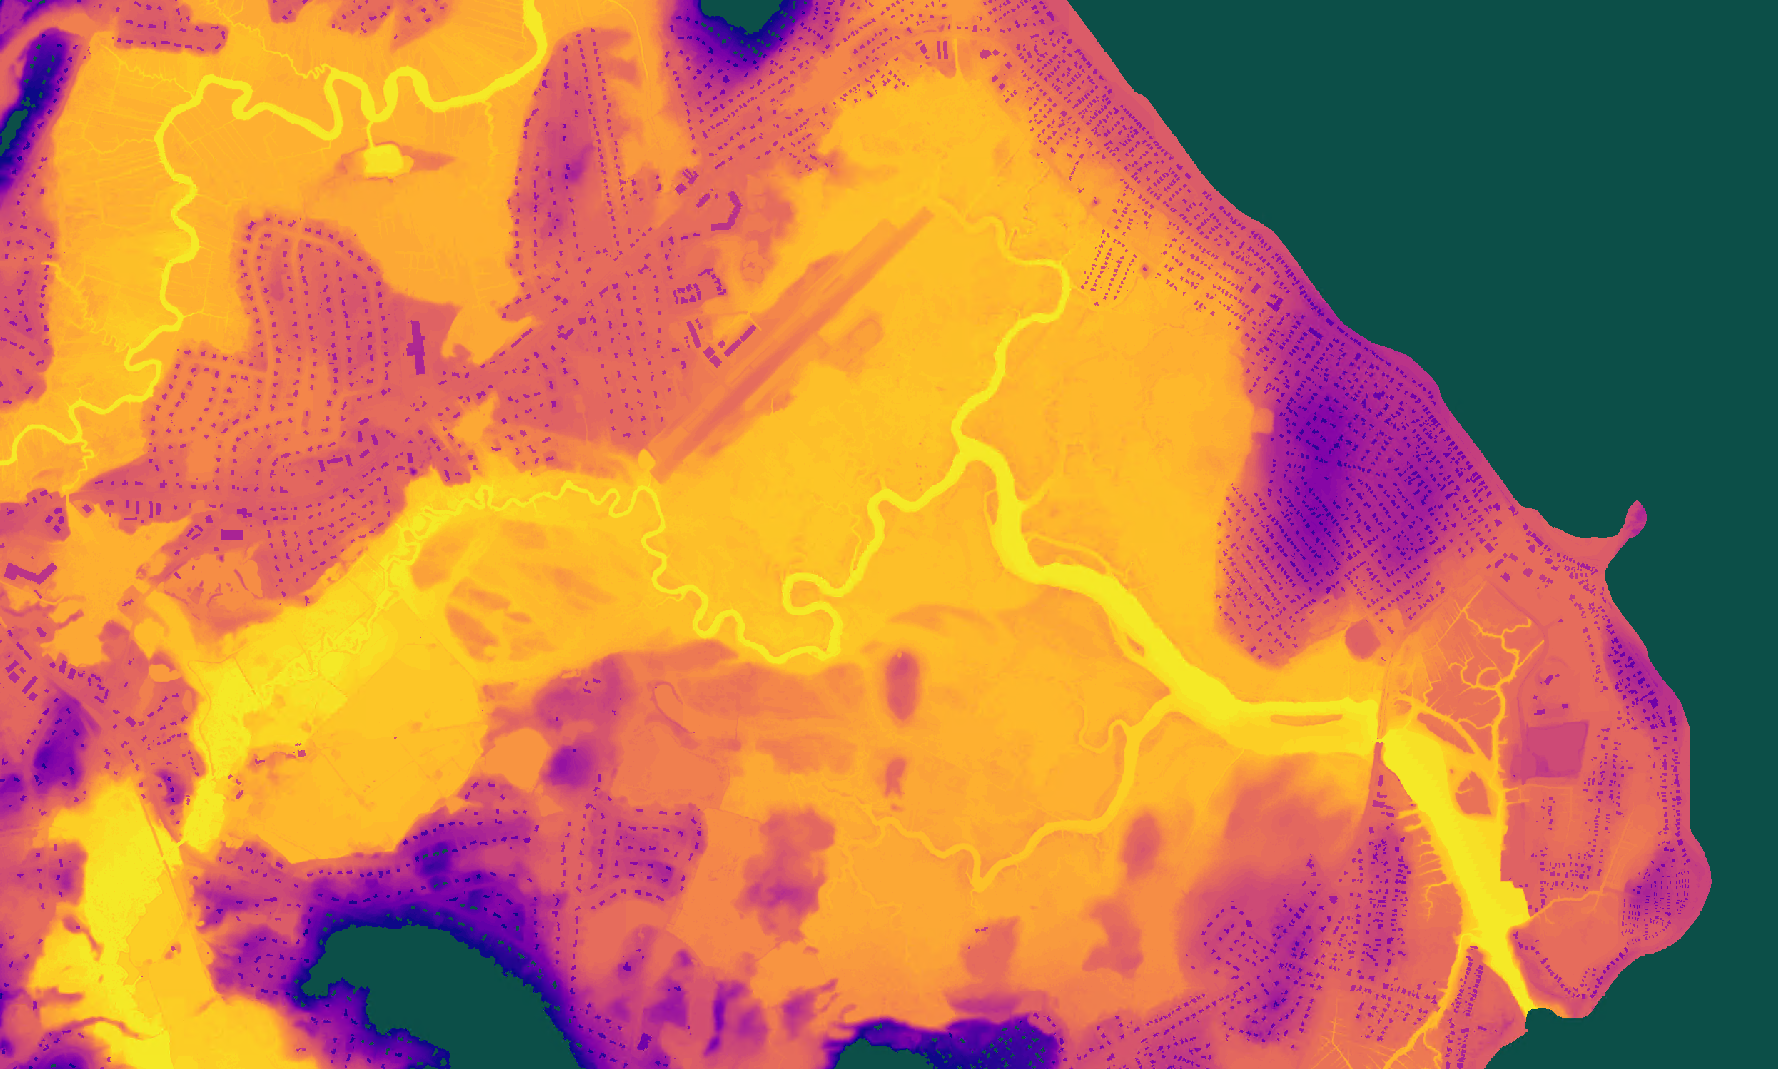
Burning (DEM Preprocessing) – How is high-resolution terrain, land use, building, and infrastructure data pre-processed and “burned” together to create a digital twin of the flood-risk landscape, and why does micro-topography matter so much at this stage?
Pre-processing is where raw data is transformed into the structured, physically consistent representation of the landscape that the flood model runs on. Terrain data is cleaned and hydrologically conditioned — depressions are filled or breached, flow directions are enforced, and the digital elevation model is made internally consistent for hydrological routing.
Land use data, categorized into detailed classes capturing impervious surfaces, vegetation, agricultural land, and built environment, is aligned to the terrain grid. Building footprints and infrastructure elements such as roads, bridges, culverts, and embankments are “burned” into the terrain — meaning their physical effect on water flow is encoded directly into the elevation surface.
This burning step is critical. A road embankment, an underpass, or a low garden wall can completely redirect the path of floodwater in an urban environment. Without encoding these features, the model would route water as though the landscape were bare earth, producing results that look plausible at regional scale but fail badly at the street and building level.
Research has established that micro-topographic features — variations at the scale of tens of centimeters to a few meters — are among the most important determinants of where pluvial floodwater ponds and flows. At 1×1 m resolution terrain, the small depressions, curb lines, and surface gradients that govern where excess water accumulates are captured. Coarser terrain data, even at 10 m resolution, systematically misses these features and tends to both mislocate and overestimate flood extent.

Excessive water – How does the model represent soil infiltration and drainage infrastructure capacity, and what happens in the simulation when that capacity is exceeded and excess water begins to pond and flow?
Not all rainfall becomes surface flood water. Before any ponding or flow can occur, precipitation must first saturate available infiltration capacity in the soil and overwhelm the carrying capacity of any drainage infrastructure present. The 7Analytics model accounts for both.
Soil infiltration is represented through infiltration rate parameters derived from soil type and land use data. Impervious surfaces — roads, rooftops, paved areas — contribute runoff almost immediately, while vegetated or permeable soils absorb rainfall at rates that decrease as they approach saturation. The model tracks this absorption continuously, adjusting the volume of water available for surface routing at each time step.
Drainage infrastructure capacity — the ability of pipes, culverts, gutters, and channels to carry water away — is represented through effective capacity thresholds rather than full pipe network simulation.
Where detailed drainage data is available it is incorporated directly; where it is not, infiltration rates serve as a proxy for pipe capacity. When the combination of rainfall intensity and duration exceeds what soil and drainage can absorb and remove, the model treats the remaining water as excess. This excess water then enters the surface routing logic: it fills landscape depressions, spills between connected low points when depression storage is full and flows downslope according to the terrain. The result is a physically grounded representation of the ponding and flow dynamics that characterize real pluvial and flash flood events.
Calibration – How does the AI model learn from local conditions — including sensor history, drainage patterns, and historic flood events — to continuously improve localization and accuracy?
A flood model that cannot learn from experience will gradually diverge from reality as land use changes, cities sprawl, infrastructure is modified, and weather patterns shift. The 7Analytics system is designed to update continuously as new information arrives.
Lightweight machine learning threshold models monitor incoming rainfall accumulation patterns and compare them against historical sequences that have preceded flooding at specific locations. These models update as new observations are added, sharpening their understanding of the rainfall signatures that trigger local flooding. Where river level sensors are present, the system assimilates real-time stage readings to correct and constrain the hydrological predictions — a process of continuous data assimilation that keeps the model anchored to observed conditions during an unfolding event.
At a deeper level, the ambition is to apply AI training on historical flood events to calibrate the model’s representation of local flood dynamics. The system can also incorporate sensor data from IoT devices and local gauging networks as they are deployed, progressively improving site-specific accuracy over time.
Orchestration – What are the four stages of the real-time modelling pipeline, and how does each stage handle the computational demands of continent-scale, sub-meter-resolution prediction?
The real-time modelling pipeline runs continuously across four distinct stages.
• Data ingestion handles the continuous intake of meteorological, hydrological, and remote-sensing data streams. This stage must manage highly variable data volumes — quiet periods interspersed with sharp surges when severe weather develops across multiple basins simultaneously.
• Preprocessing transforms raw inputs into model-ready form: terrain conditioning, land use alignment, weather data interpolation, and sensor data quality control all happen here. Each preprocessing workload is self-contained, allowing independent scaling by region or watershed.
• Model inference runs the flood prediction itself — the WCA2D routing logic combined with the ML threshold and flow forecast models — producing depth, extent, and probability outputs at hourly time steps across the 72-hour window. This stage processes trillions of predictions per hour at sub-parking-lot spatial resolution.
• Knowledge distribution packages and delivers outputs to end users: dashboards, APIs, alert systems, and map visualizations. Deterministic pipeline design — where identical inputs always produce traceable, auditable outputs — is central to this stage, ensuring that every prediction can be explained and verified.
Kubernetes enables the system to scale resources independently at each stage, ensuring that a landfalling storm or stalled weather system does not degrade performance across the entire platform. Shared datasets are read once and reused across dependent workloads, improving both cost efficiency and energy use.
Flood types – How does the system simultaneously model all surface flood types — pluvial ponding, flash floods, and river flooding across first, second, and third river orders — within a single unified framework?
Traditional flood warning systems tend to focus on first-order rivers — the major watercourses for which gauging networks and established national forecast models exist. Second and third-order streams, and rain-driven surface flooding (often with no connection to a named watercourse), are typically either excluded or handled by separate, disconnected systems.
7Analytics addresses all surface flood types within a single modelling framework. Pluvial flooding — ponding driven by rainfall intensity exceeding local infiltration and drainage capacity — is captured through the excess water fill/spill/flow logic described above. Flash flooding in smaller catchments is driven by high-resolution rainfall inputs routed through the local terrain and catchment structure, extending flood intelligence into stream orders that national systems do not resolve. For US major rivers and coastal storm surge, 7Analytics builds directly on NOAA’s National Water Model, ingesting its operational forecasts as authoritative boundary conditions and localizing them to the building level — translating national flow predictions into the property-specific depth and timing that emergency managers and asset owners need to act.
The integration of all flood types within one framework matters because real events do not respect these distinctions. A prolonged rainfall event will simultaneously saturate soils, overwhelm drains, fill small stream channels, raise major river levels, and — in coastal areas — interact with storm surge driven by offshore conditions. A system that models only one of these processes will misrepresent the compound nature of the event and give an incomplete — potentially dangerously incomplete — picture of where and how deeply flooding will occur.
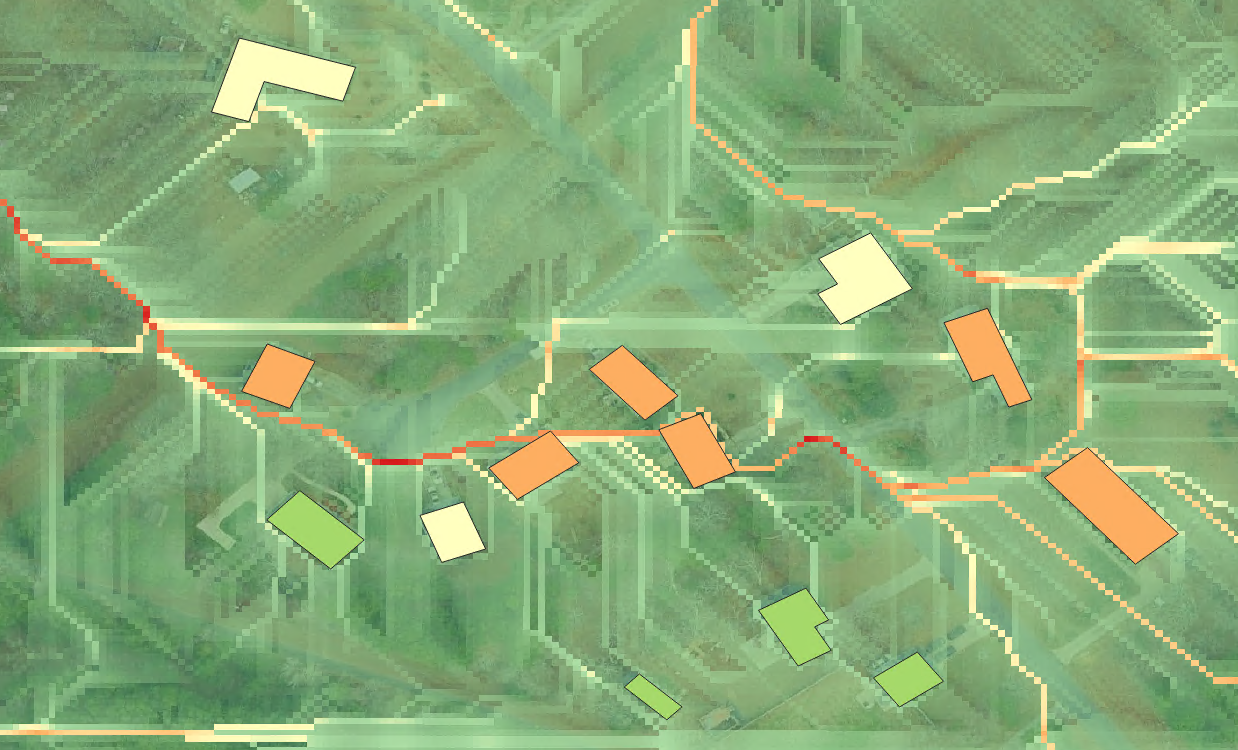
Early Flood Warnings – How does the 72-hour flood outlook translate model outputs into site-specific, hourly-updated early warnings, and what thresholds trigger an alert to end users?
The 72-hour outlook produces a continuous time series of flood depth and probability for every building, infrastructure asset, and user-defined warning point within the model domain. This time series is updated at least hourly as new precipitation observations, weather forecast updates, and sensor readings are assimilated.
Early warnings are triggered when predicted flood depth or water accumulation exceeds user-defined thresholds at specific locations. These thresholds reflect different impact levels — for example, minor disruption, likely ground-floor flooding, or potential structural damage. If a threshold is expected to be exceeded within the next 72 hours, the system issues an alert with estimated timing, depth, and duration.
Hourly updates combined with multi-day forecasts are key. Many response measures—such as moving assets, adjusting operations, or deploying barriers—require more than 24 hours of lead time. The system is designed to provide this window while improving accuracy as the event approaches through continuous data updates. This enables informed action before, during, and after a flood event.
Deployment – In which ways do actual events channel through the model – guiding users on flood impacts and improving accuracy over time?
In April 2026, a flood event developed in a Hawaiian catchment following rainfall that crossed forecast thresholds at 17:00. 7Analytics forecast model was only running for the CONUS (contiguous US) not the affected basin at that moment. Within six hours, the client had received flood depth and extent outputs at high resolution, produced at hourly timesteps across a 72-hour forecast horizon.
The activation drew on pre-conditioned terrain and land-use surfaces maintained continuously for the region, the WCA2D inference engine, and the four-stage orchestration pipeline set out in this document.
Every flood event the system captures is a permanent addition to 7Analytics’ calibration base. Every event missed before its information half-life — typically a few days for surface traces, weeks for damage and claims data — is lost to the model forever. Every activation makes the next simulation more accurate; every region onboarded extends the transfer-learning surface for ungauged basins elsewhere.
Competitors operating quarterly model updates are not calibrating at the same speed as the phenomenon they are modelling.
Geospatial data is not a ‘per event’ data set. 7Analytics maintains pre-conditioned, burned landscapes continuously across every region it covers, frequently updated to match changing land use patterns and geomorphic change through to hydrological conditioning, building and infrastructure encoding all kept current in the background. Coupled with our rapid simulation software and orchestration pipelines it enables us to update models frequently and accurately.