7Analytics’ Supersampling turns freely available 30 m satellite elevation data into a 10 m bare-earth terrain model, cutting typical elevation error by more than 70%. It gives places without airborne laser scanning a terrain model closer to lidar quality, at a fraction of the cost and time.
Why terrain detail matters
Water follows the ground. Every flood map or site-specific flood risk assessment starts with a digital elevation model, and its quality sets the ceiling for everything built on top of it.
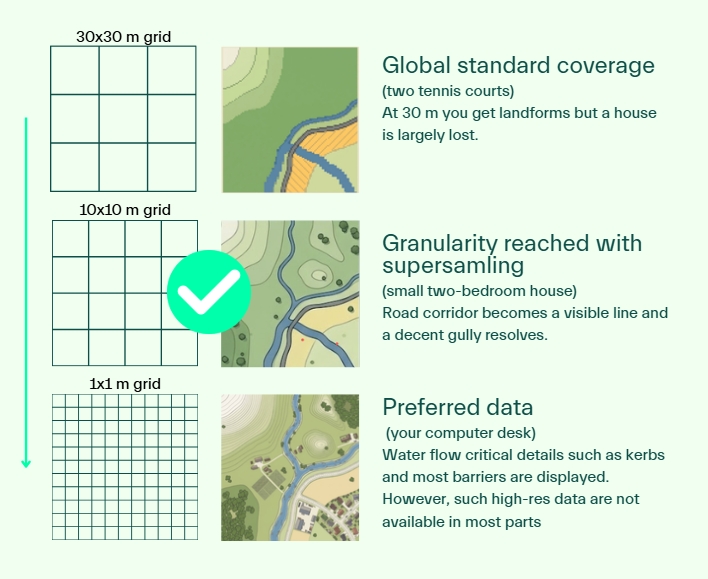
The best terrain models come from airborne lidar capturing the surface in cells often less than 1×1 m. They are sharp and accurate, but expensive, slow to update and missing across large parts of the world.
Where lidar is absent, analysts fall back on global datasets such as the satellite radar-based Copernicus GLO-30. These are consistent and free, but a 30 m grid cell is roughly the size of two basketball courts or three tennis courts. Ditches, embankments, stream channels and small depressions simply disappear.
The hidden problem: surface, not ground
Resolution is only half the issue. Global datasets built from radar such as the Copernicus GLO-30 are surface models (DSMs). They record the top of whatever the radar hits first: tree canopy, rooftops, bridges.
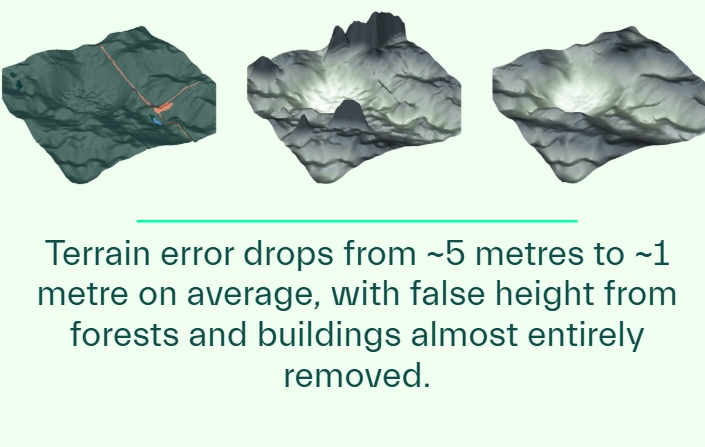
For anyone modelling water, that is a serious flaw. In our validation areas, the 30 m input sits on average about 8 m above the true ground in forest, and around 2 m too high in built-up areas. A forest edge can look like a wall. A tree-lined river can appear to flow uphill.
What Supersampling does: two jobs in one step
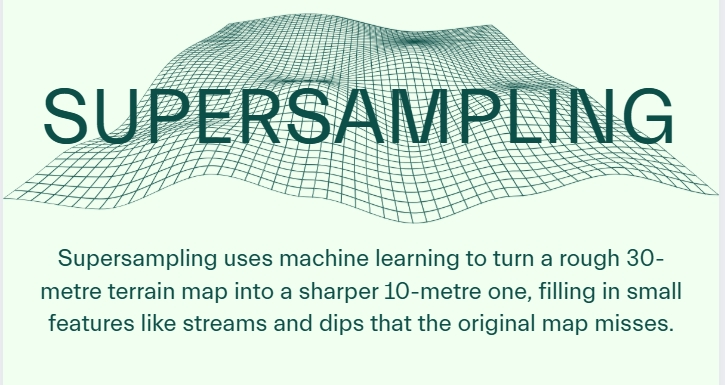
Our Supersampling solves both problems at once. It takes a 30 m surface model and returns a 10 m bare-earth terrain model.
- It removes what is on top of the ground. Trees, buildings and other above-ground features are stripped away, recovering the terrain underneath.
- It sharpens the ground itself. The grid becomes three times finer in each direction, nine times more cells, bringing back landforms that the coarse grid blurred out.
Simple resampling, such as bilinear interpolation, can produce a 10 m grid too. But it only spreads the existing values more thinly. It adds no new information and keeps every tree and rooftop in place. Supersampling learns what real terrain looks like and reconstructs it. In fact, it offers improvements over lidar by yielding a spatially consistent output, whereas conventional lidar datasets suffer with seam artifacts in the intersections of different surveys.
How it works
At its core, Supersampling is a deep neural network of the U-Net family, a design widely used for image-to-image tasks in remote sensing. We trained it to answer one question: given what a satellite sees, what does the ground beneath really look like?
- What it learns from. The model was trained on North American and European territories and covering a comprehensive set of terrains, including mountains, forests, farmland, coastlines and cities. For every tile, the “answer key” is a 10 m bare-earth DEM derived from airborne lidar.
- What it looks at. Elevation alone is not enough to tell a hill from a forest. Alongside the Copernicus GLO-30 elevation, the model sees Sentinel-2 imagery (visible and near-infrared bands), land-cover classes, slope and hillshade. This context tells it where canopy or buildings are likely inflating the surface.
- What it cares about. Training rewards getting both the height and the slope right, with extra weight on slope. Slope and its direction are what drive water flow, so a model that is right on average but wrong on gradients would be of little use for hydrology.
- How we test it. All validation results come from areas the model never saw during training, scored on every land pixel at the full 10 m resolution. The benchmark is the same Copernicus data resampled to 10 m, which is what most users would otherwise work with.
How well it works
A model is only useful if it works beyond the places it learned from. We tested the Supersampling model, unchanged, in European territories entirely outside the training data, with landscapes ranging from boreal forest to Mediterranean hills and farmland. These validation areas were covered by high-resolution lidar data making a head-to-head comparison possible: Copernicus (resampled to 10 m) vs Supersampling vs lidar-based elevation model.
Across more than 12 billion validation pixels, Supersampling cuts the typical elevation error from about 4 m to under 1 m.
This setup allows for many tests and confirms the significant improvement brought by Supersampling, but also its limitations.
Where the limits are
- Steep terrain is harder. On slopes above 15°, error rises. Steep ground is also under 10% of the training data.
- Fine detail can be smoothed. Very sharp features, such as narrow ridges or cut banks, may come out slightly softer than in lidar.
- Bare rock on steep slopes is the one surface where the model tends to sit slightly low, by under a meter on average.
- It is not lidar. Where a recent lidar survey exists, lidar is preferred. However, Supersampling can help even with issues that lidar struggles with.
Why it matters
Supersampling brings near-lidar terrain to any area covered by Copernicus, which is almost the entire land surface of the Earth.
- Flood and stormwater modelling gets flow paths, channels and depressions that 30 m data hides, without forest canopy acting as false barriers.
- Infrastructure and site screening can assess roads, rail and new developments early, before commissioning a survey.
- Climate risk and insurance can apply one consistent terrain basis across portfolios that span countries with very different data coverage.
- Planning in data-poor regions starts from a realistic ground surface instead of a coarse approximation.
It is the terrain layer beneath 7Analytics’ own flood and water-risk analytics, and it is available to partners who need better ground truth where lidar does not reach.
Get in touch to see Supersampling on your area of interest.